Creative Strategy
Creative Strategy
ROAS Examples That Expose Your Growth Gaps
ROAS examples for apps and brands: see how revenue, attribution, payback windows, and creative decisions change what profitable growth looks at scale.

A 4x ROAS can be a scaling signal. It can also be a reason to stop spending. The difference is not the formula. It is what sits behind the number: margins, attribution, repeat revenue, platform reporting, and the creative that generated the conversion. These ROAS examples show why a headline metric without context is often expensive fiction.
ROAS, or return on ad spend, is calculated as attributed revenue divided by advertising cost. Spend $10,000 and generate $40,000 in attributed revenue, and your ROAS is 4.0x. Simple math. Hard decisions.
For growth teams buying across Meta, TikTok, Google, AppLovin, and CTV, the real job is to decide whether that return is profitable, durable, and scalable. A campaign can hit its ROAS target while hiding weak retention, a shrinking creative pool, or revenue that was going to happen anyway.
ROAS Examples That Mean Different Things
Example 1: A subscription app with strong day-zero ROAS
A wellness app spends $25,000 on Meta and reports $75,000 in first-purchase revenue. Reported ROAS is 3.0x.
That sounds healthy until the unit economics enter the room. If a new subscriber pays $75 for an annual plan, but Apple or Google takes a platform fee, payment processing applies, refunds run at 10%, and onboarding support has a cost, the contribution margin may be closer to $42 per purchase. If the campaign drove 1,000 purchases, the business has $42,000 in contribution against $25,000 in media spend. That is a 1.68x contribution return, not a 3.0x profit multiplier.
The campaign may still deserve more budget. It depends on the company’s payback target and whether those customers renew. But calling it a 3x winner without accounting for net revenue invites bad forecasting.
This is why subscription advertisers should define ROAS in layers: gross purchase ROAS for platform optimization, net revenue ROAS for finance, and cohort contribution ROAS for real scaling decisions. One metric cannot do all three jobs.
Example 2: A mobile game with weak install economics and strong payer value
A mobile game spends $50,000 on TikTok and acquires 25,000 installs at a $2 CPI. Within seven days, the campaign produces $35,000 in attributed in-app purchase revenue, or 0.7x D7 ROAS.
A team focused only on short-window ROAS might kill the campaign. That could be correct for a hypercasual title with limited long-term monetization. It could be completely wrong for a deeper strategy game where payer behavior matures over 30, 60, or 180 days.
Suppose historical cohorts show that users with the same D1 retention, tutorial completion rate, and early purchase behavior generate 2.2x D180 ROAS. The campaign is not yet profitable on day seven, but it may be a strong source of high-value users. The decision comes down to cash flow, confidence in the forecast, and whether the campaign can scale without degrading those quality signals.
The trap is using long-term LTV as an excuse for every underperforming campaign. Forecasts need proof. If this TikTok cohort has lower retention or lower first-session engagement than the historical benchmark, projected ROAS is a hope, not a model.
Example 3: An ecommerce brand with a great reported ROAS and no incrementality
A consumer subscription brand runs retargeting ads to recent site visitors. It spends $8,000 and reports $64,000 in revenue: 8.0x ROAS.
The number is impressive because the audience already knew the product. Many had added to cart, started checkout, or searched the brand name. The ads may have recovered some lost sales. They may also have claimed credit for purchases that email, organic search, or direct traffic would have captured anyway.
Now compare that with prospecting. A creator-led Meta campaign spends $30,000 and reports $60,000 in revenue, a 2.0x ROAS. On paper, retargeting wins by a mile. In reality, prospecting may be creating the future retargeting pool, expanding branded demand, and acquiring customers with better second-order purchase rates.
Neither campaign should be judged in a vacuum. Retargeting needs frequency controls, holdout testing where practical, and realistic attribution windows. Prospecting needs cohort analysis and a creative system that can keep finding new demand. ROAS is useful. Channel-level ROAS without incrementality is incomplete.
Example 4: The creative winner that loses when you scale it
A gaming studio tests two concepts on Meta. Concept A is a polished cinematic trailer. Concept B opens with a playable-looking fail moment, uses a fast creator voiceover, and shows the game’s core loop in the first three seconds.
At $500 per concept, B drives a 35% lower CPI and 25% higher D7 ROAS. It is the clear winner. The team shifts $100,000 into B, performance falls, and CPI rises 40%.
That does not mean the test was wrong. It means the team confused an initial signal with unlimited audience capacity. A single hook can saturate quickly, especially in a narrow genre or high-frequency environment. The correct response is not to retreat to the cinematic trailer. It is to build a concept family around the winning mechanism: new creators, new openings, alternate gameplay tension, different proof points, and platform-native edits.
Stop testing ads as isolated artifacts. Start testing hooks, claims, visual setups, and motivations that can generate multiple assets. ROAS improves when creative production is designed for iteration, not one-off launches.
What a Profitable ROAS Target Actually Looks Like
There is no universal “good ROAS.” A 1.5x ROAS might be exceptional for a high-margin subscription app with strong renewal rates. A 5x ROAS can be unacceptable for a low-margin physical product with shipping, returns, and fulfillment costs.
Start with the economics. Calculate net revenue after taxes, platform fees, discounts, refunds, and variable costs. Then determine how much contribution margin the business requires from a new customer over the relevant payback window. Finally, translate that into a media target.
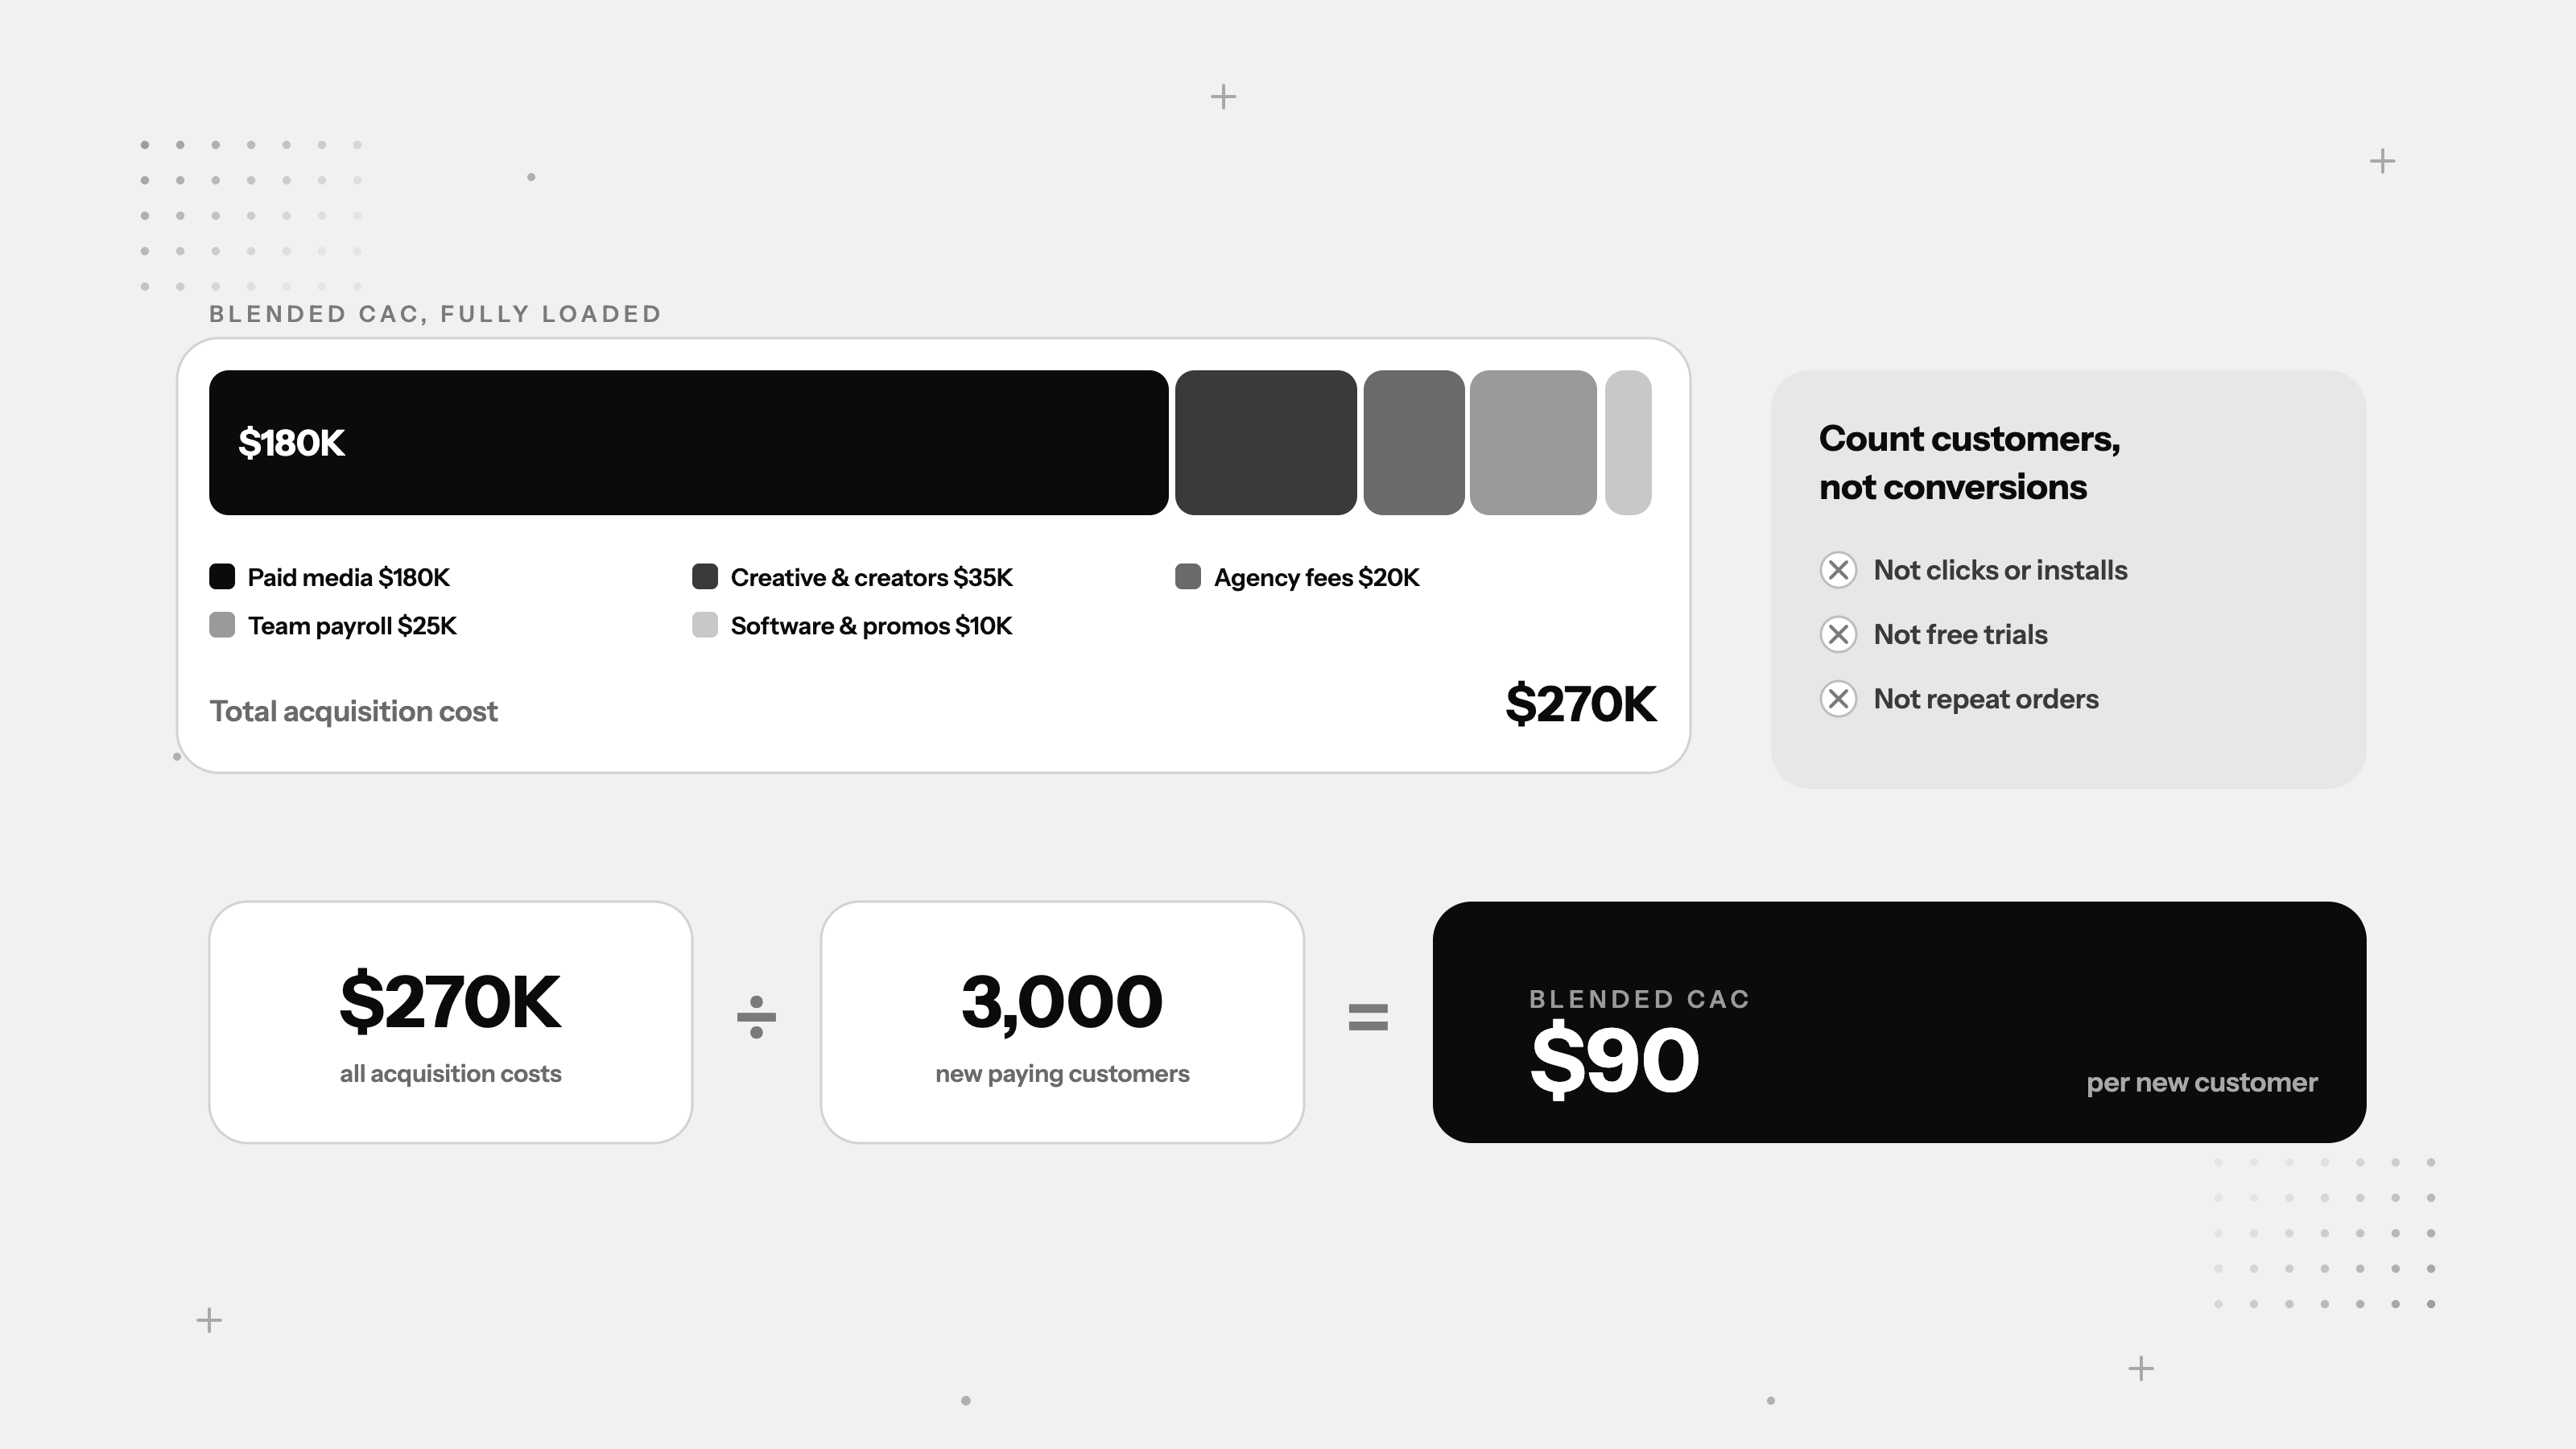
For example, a brand earns $90 in net contribution from a customer over 90 days and is willing to spend $45 to acquire one. Its allowable CAC is $45. If its average first order is $60, platform-reported day-zero ROAS does not need to be 2.0x for the campaign to work. The business can responsibly buy at a lower immediate ROAS if the remaining value is reliably realized later.
That last condition matters. A target based on modeled LTV is only useful if finance, product, and growth agree on the data. Otherwise, media buyers optimize toward a number nobody trusts.
How to Read ROAS Without Letting It Mislead You
The strongest teams pair ROAS with the metrics that explain it. For apps, that usually includes CPI or CPA, conversion rate, retention, payer rate, average revenue per user, and cohort quality. For ecommerce and subscriptions, it includes new-customer share, CAC, refund rate, contribution margin, repeat purchase behavior, and payback period.
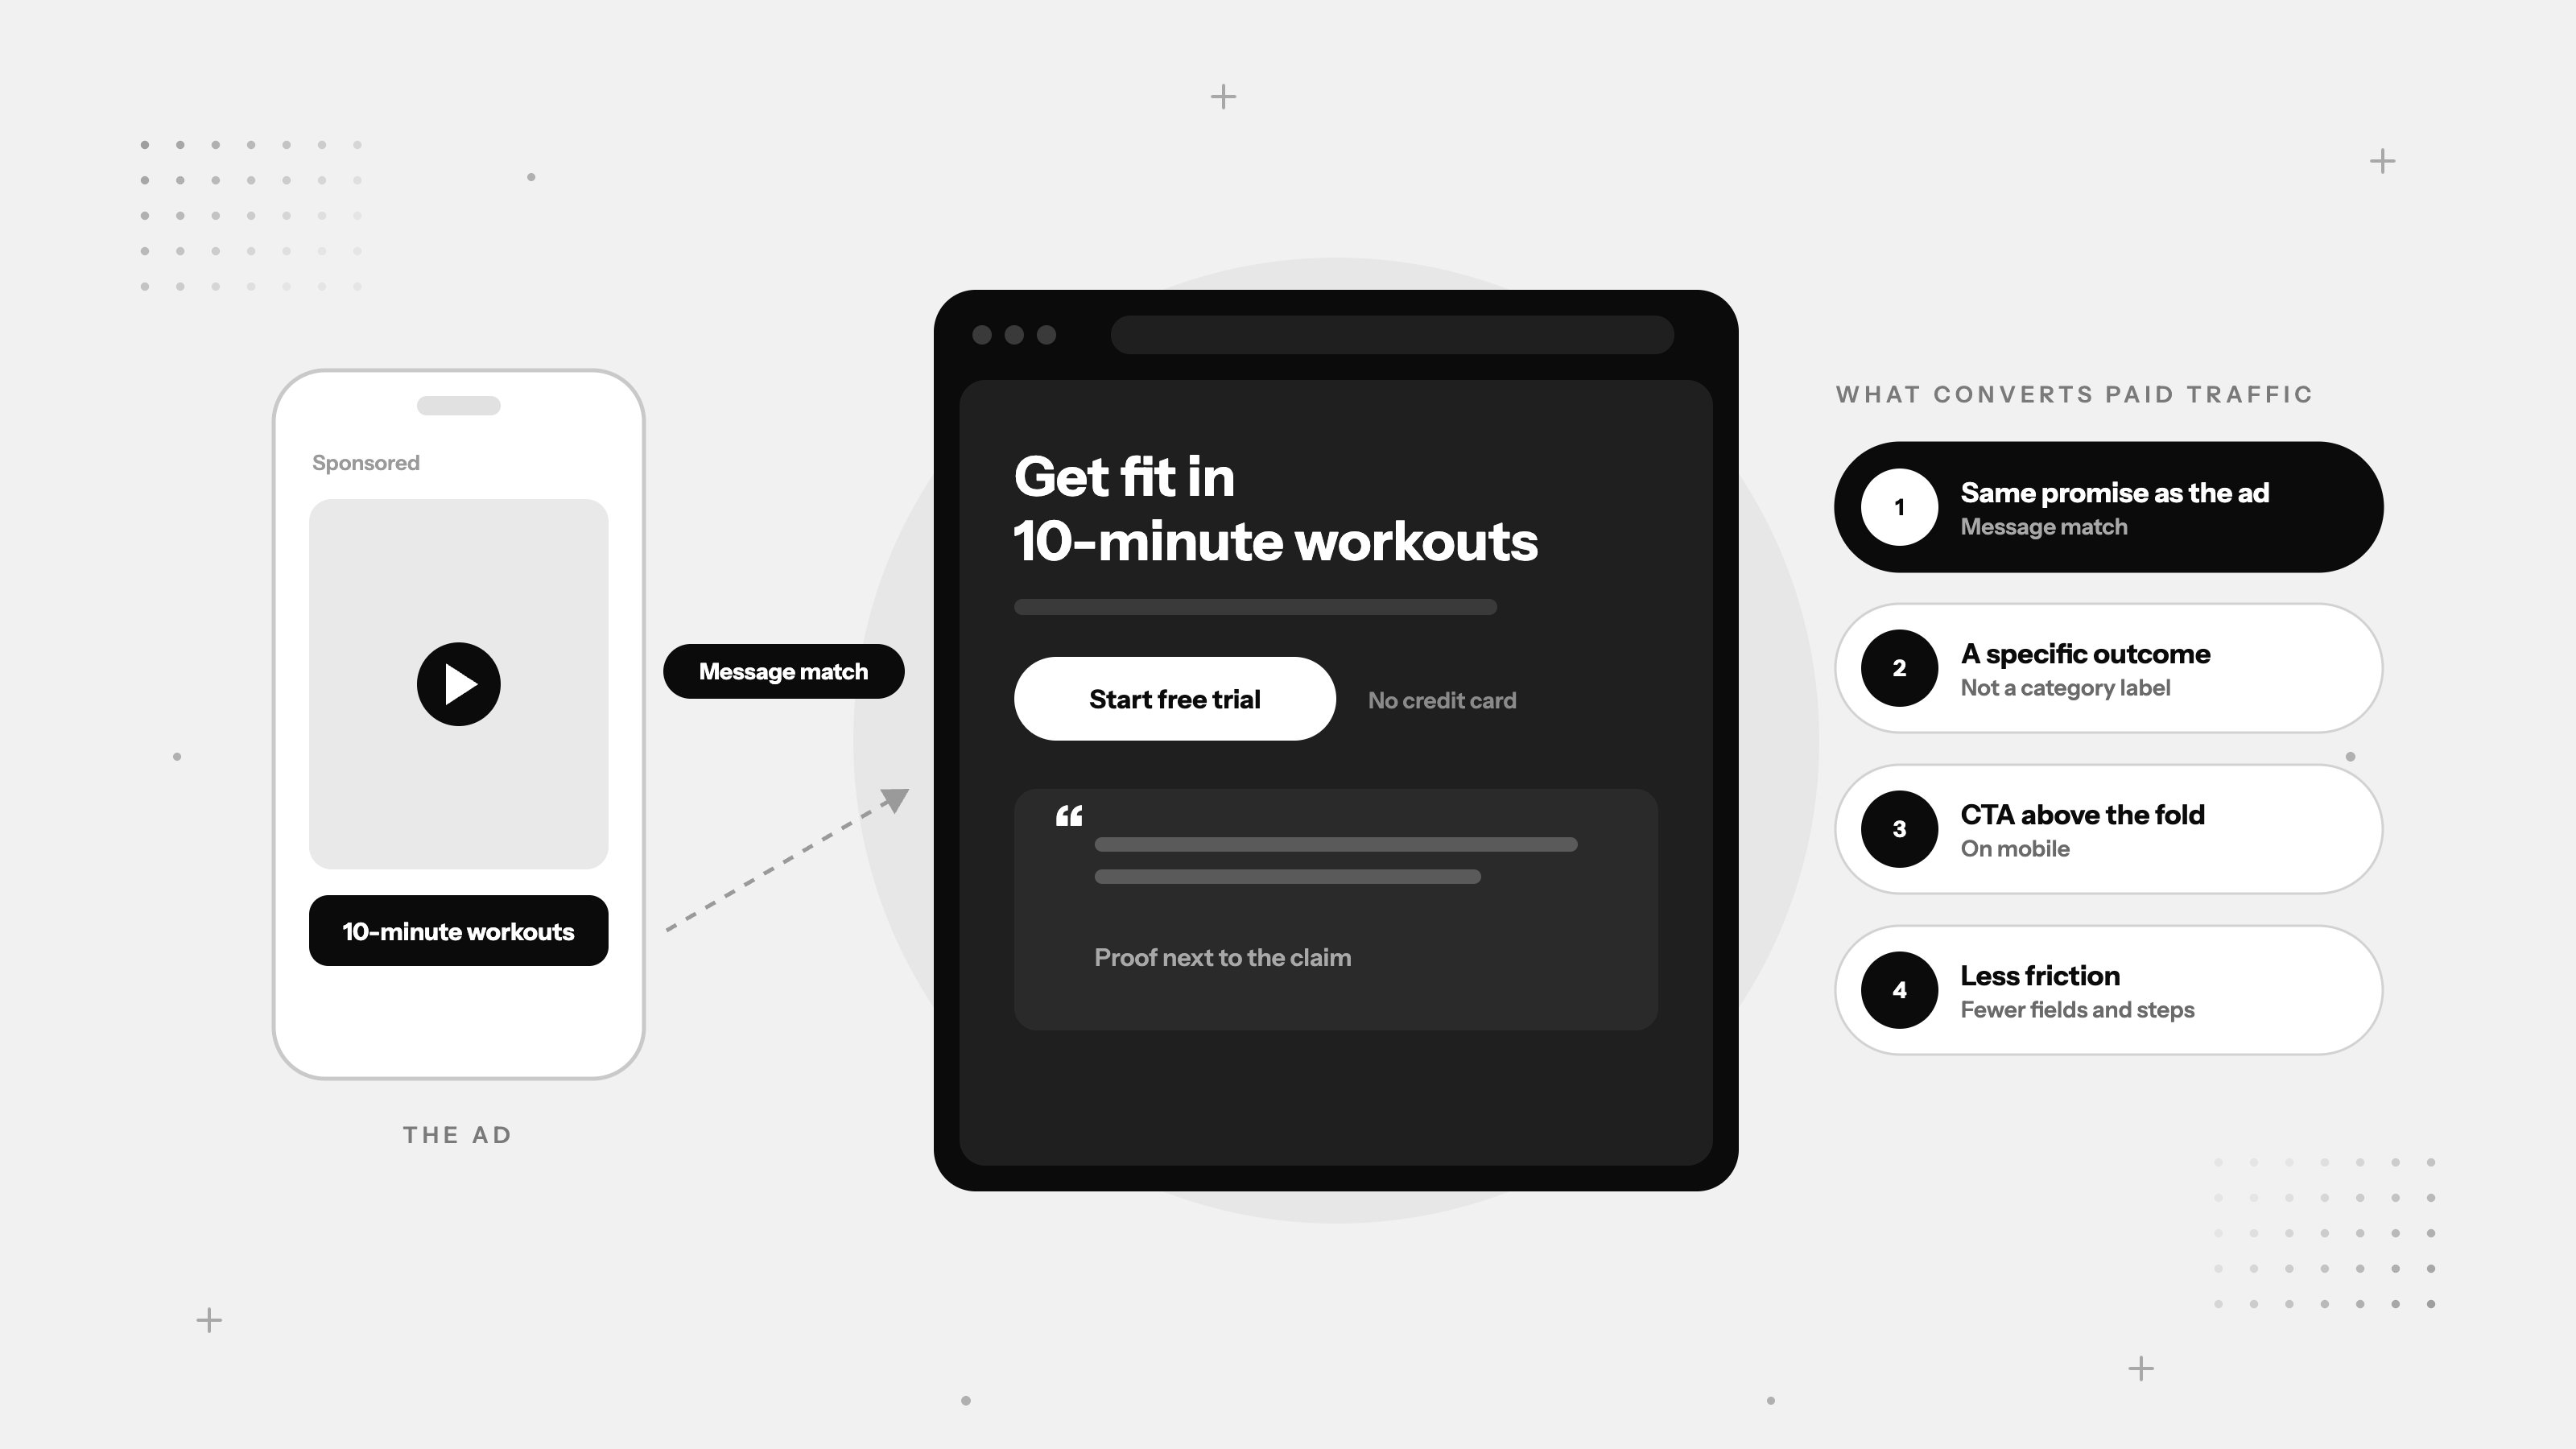
Creative deserves a seat in that analysis. If ROAS drops, do not assume targeting is the culprit. Check whether spend concentrated behind tired assets, whether the hook is losing attention in the first seconds, or whether the ad’s promise no longer matches the landing page or product experience. Media efficiency often starts to break in the creative before it appears in the dashboard.
Attribution also needs an operating rule. Platform dashboards are directional optimization tools, not neutral truth machines. Compare them with your source of record, keep attribution settings consistent during tests, and avoid declaring a creative winner from tiny sample sizes. A 5x ROAS result on $200 of spend is a hypothesis. A result that holds across spend, placements, and multiple creative variations is evidence.
Build for Payback, Not Screenshot ROAS
The best ROAS examples are not the ones with the biggest number. They are the campaigns where the team can explain the number, reproduce it, and increase spend without watching efficiency collapse.
That requires a connected operating system: clear economics, honest attribution, creative built for the platform, and a steady pipeline of new angles before fatigue arrives. When the next ROAS report lands, ask a harder question than “Is this good?” Ask what customer behavior, creative mechanism, and margin assumption made it possible. That is where scalable growth starts.